Diagrams depicting information flow through processes or systems are called data flow diagrams (DFDs). DFDs are useful for discovering potential problems, improving efficiency, and creating better processes. A process or system can be viewed in a variety of ways, ranging from simple overviews to complex, granular displays.
DFDs are the viewable depiction of your application. DFDs are basically of 2 types :
- Physical DFDs
- Logical DFDs
Physical DFD vs Logical DFDs
A physical data flow diagram depicts how the system flow will work. Physical DFD is nearly close to execution.
Logical data flow majorly focuses on how the business logic will be implemented in the application.
Major Components of DFD
 Entities
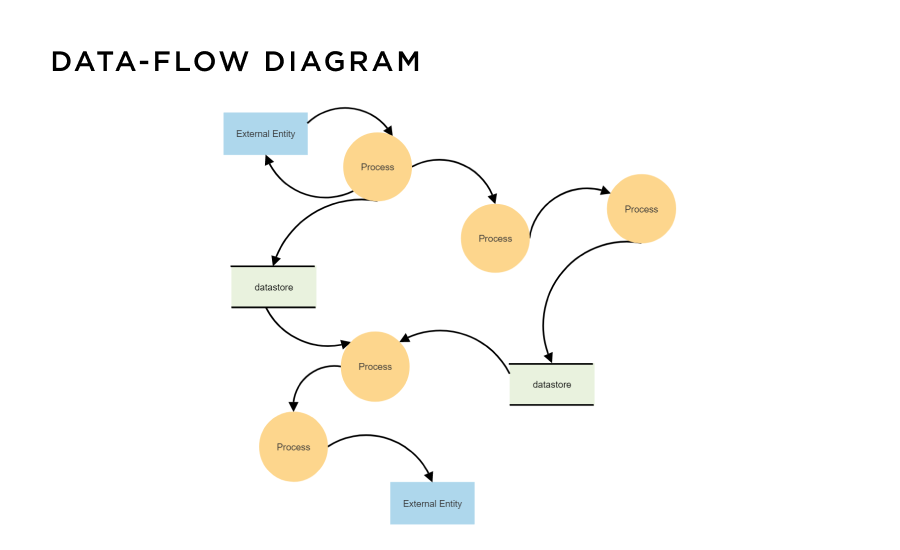
A person, organisation or system/application could be referred to as an External Entity. It is also known as terminators, sources, sinks, or actors.
The information either flows from entities into the system or vice versa.
The entities are represented as rectangle boxes with entity names posted in the middle.
Process
A process is an action or a procedure that is carried by the application. Processes work on some inputs and provide outputs.
It is recommended to start a process name with a verb and end it with a noun. Input and output data flows should be present. DFD processes are uniquely numbered. Segmented rectangles represent processes.
Data Stores
Data stores are used to store the information or files waiting to be processed in the system. Data input flows through a process and then through a data store while data output flows through a data store first and then through a data process.
Data Flow
The flow of data within the application/system is called data flow. Nouns should be used in the names of data flows. Arrows are used to represent data flows. The flow direction is indicated by the arrow and the data name is written above it.
Importance of Data Flow Diagrams
This technique is useful for representing the results of structured software analysis as well as the flow of documents within an organisation.
Levels in DFDs
There are mainly 3 levels of DFD that will interpret the data flow for any particular system:
Level 0 – Sometimes referred to as a “context diagram,” the system being represented is seen at its most basic level.
Level 1- It gives a more comprehensive view of the system, incorporating subprocesses and other details. It is also the extension of the 0-level DFD which divides the process into subprocesses with its complete functionality
Level 2: Breaks down subprocesses into even more detail (if needed). This usually takes place when the system is too big.
Rules for making DFDs:
Every user needs to remember the following things for the making of the DFDs:
- The data should flow between entities to process or vice versa always.
- The data flow of the data is always represented between data stores.
- The data should not flow directly from entities to data stores.
- Every process in the DFD must have one input and one out data flow.
- Similarly, a data store must also have one input and one output flow arrow as well.
- The data flow arrow can cross or intersect each other at any point in the diagram.
- Every process in the diagram must be linked with at least one data store or to any other process.
Merits Vs Demerits of the Data Flow Diagram:
The basic advantage of the data flow diagram is that it facilitates its users with the boundaries of the system with its systematic required flow.
Whereas the disadvantage of the Data flow diagram is not defined as such but it sometimes creates a little confusion for the developer to think about the system.