Mobile usage keeps rising, and your product roadmap feels that pressure. Users now spend 6 hours and 38 minutes on their phones each day, and global consumer spending on Android and iOS apps reached $127 billion in 2024.
That volume changes expectations. Faster load times, safer transactions, tighter uptime windows, and cleaner onboarding are no longer “nice to have.” They define whether your app gets adopted or deleted.
If you are a CTO, head of product, or engineering lead, you already know the question behind every planning call: How much will this app cost, and what drives the number up or down? Budgets stretch fast once backend complexity, compliance, analytics, and infra come into scope.
In this blog, we’ll explore what mobile app development costs look like in 2026, and how to estimate them with structure instead of guesswork.
Key Takeaways
- Mobile app costs in 2026 range widely, from $40k to $400k+, driven mainly by scope, backend depth, and compliance needs.
- Architecture, integrations, and QA coverage shape budgets more than UI design or feature count.
- Maintenance requires 15–20% of the initial build cost annually, including OS updates and dependency upgrades.
- Cross-platform frameworks cut build time, but regulated sectors often require native modules and stronger backend controls.
- Accurate budgeting starts with discovery, detailed architecture planning, and clear ownership across infra, code, and release workflows.
How Much Does It Costs to Build a Mobile App in 2026
Most teams start with features, but cost depends far more on scope, backend depth, integrations, and compliance needs. A mid-range mobile app typically falls between $100,000 and $200,000, based on current industry data.
These ranges shift once you add real-time functions, multi-region infra, or privacy and audit requirements. The table below gives a clear starting point before you factor in platform choices, API complexity, user flows, and post-launch support needs.
| App Tier | Estimated Cost Range | Typical Timeline | What This Usually Includes |
| Basic App | $40,000 – $100,000 | 3–5 months | Up to 2–4 core modules or primary flows, simple backend, basic auth, limited integrations, single-region deployment |
| Moderate App | $100,000 – $200,000 | 5–8 months | Custom backend, payments, analytics, notifications, initial CI/CD setup, API integrations |
| Advanced App | $200,000 – $400,000 | 7–12 months | Real-time data flows, complex user roles, offline modes, multi-region setup, higher QA depth, stronger security controls |
| Enterprise-Grade App | $400,000+ | 9–18+ months | Multi-tenant architecture, audit trails, role-based controls, high SLAs, compliance (PCI-DSS, SOC 2, HIPAA), modular backend, layered caching |
Once you have a clear view of the pricing tiers, let’s explore the steps needed to estimate mobile app costs accurately.
Also Read: Enterprise Mobile App Development In 2025: Types, Considerations, & Process
How to Estimate Mobile App Development Cost
Teams struggle with cost estimates when features are listed without mapping them to hours, rates, compliance factors, and backend needs. A clear structure prevents this. Start with a simple formula and expand it into a model you can justify during planning and funding discussions.
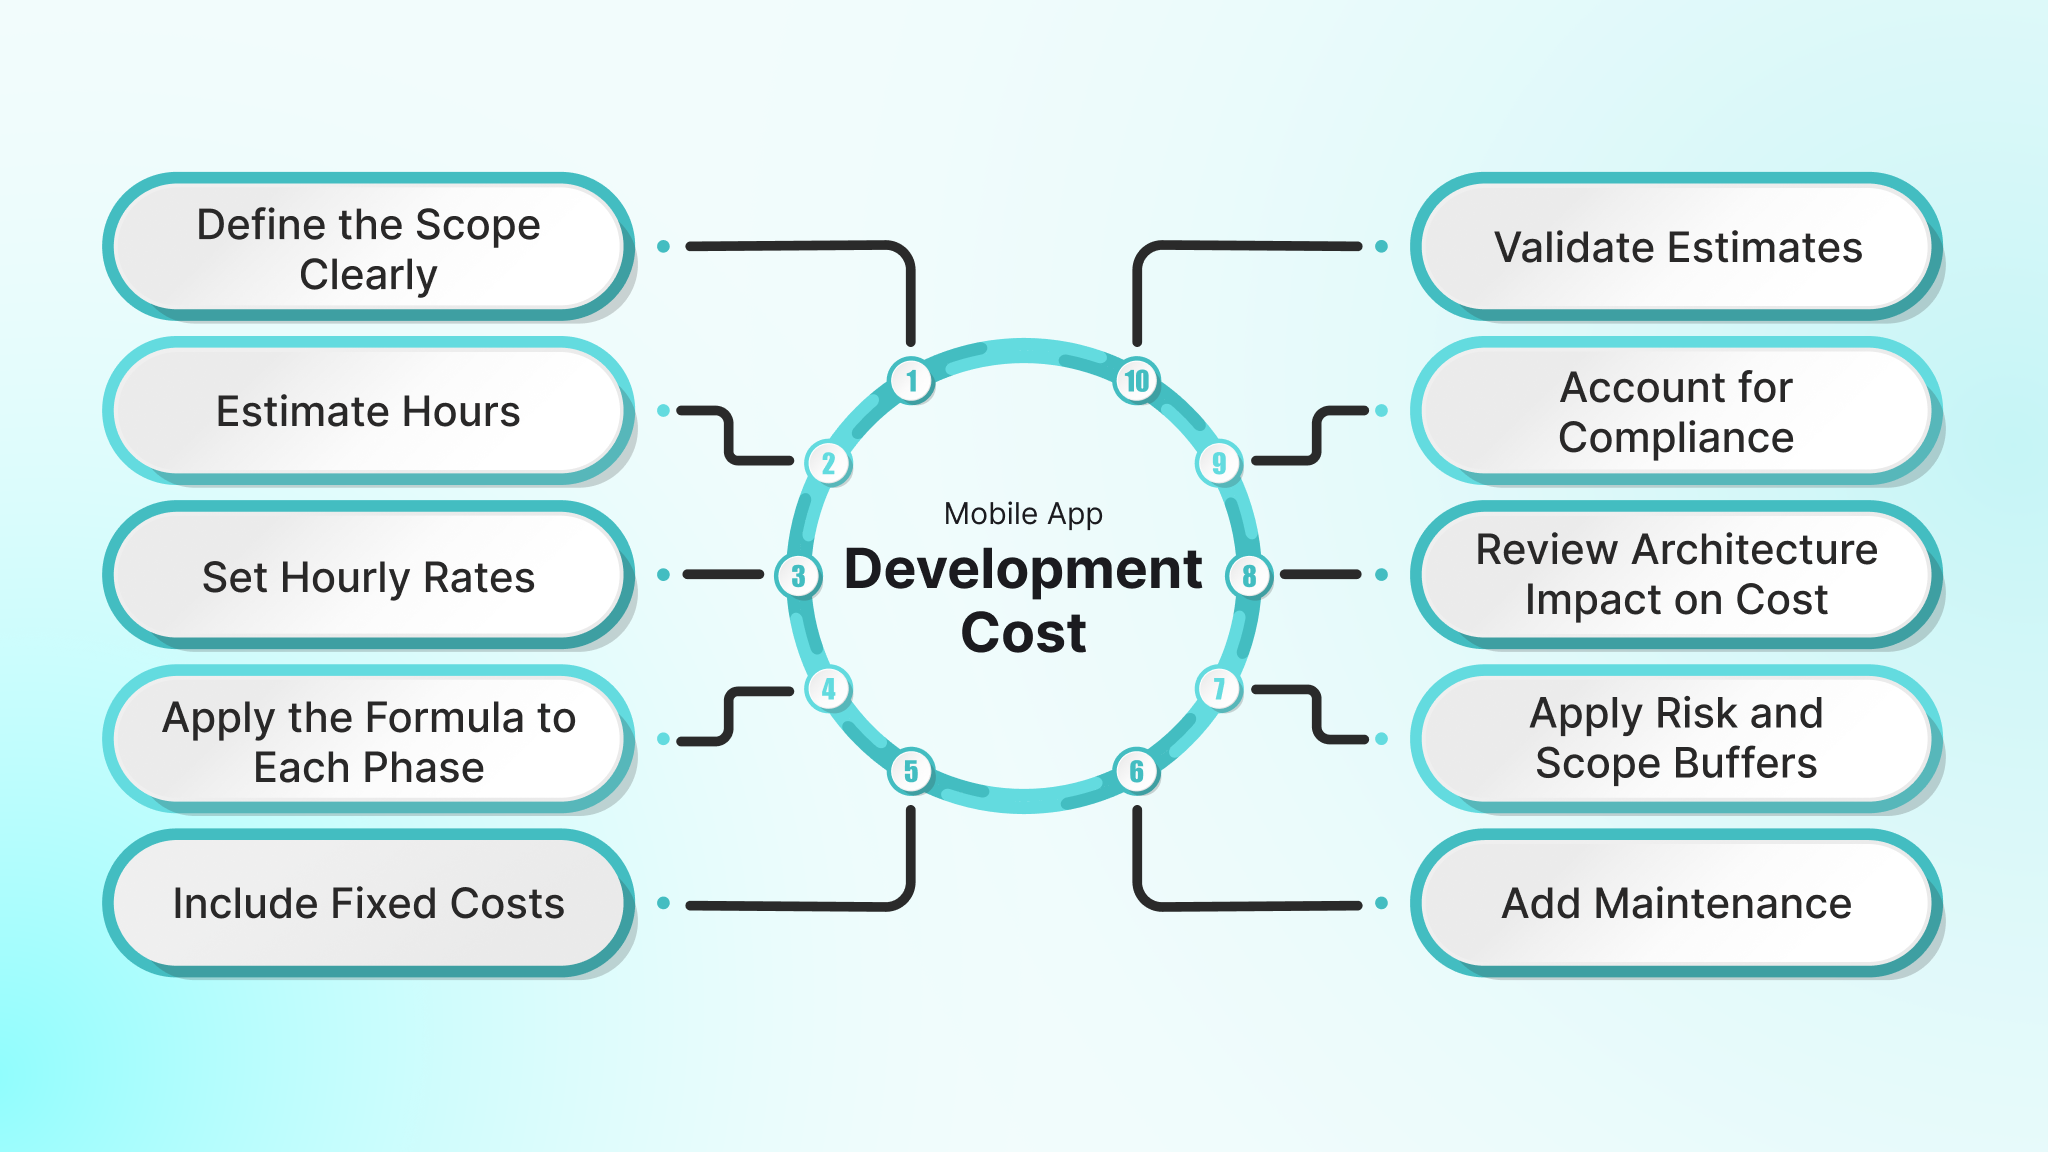
Here are the core steps senior engineering leaders use to estimate mobile app budgets with accuracy.
1. Define the Scope Clearly
A clear scope reduces variance. It should capture the functional and non-functional details that drive hours. Without this, estimates shift late in the cycle when architecture, security, or API gaps surface. Here are the items to define early:
- Platforms needed (iOS, Android, both)
- Auth flows (email, MFA, SSO)
- Backend structure (API depth, data models, caching)
- Compliance needs (PCI-DSS, SOC 2, HIPAA)
- Third-party systems (payments, analytics, KYC)
- Admin tools or dashboards
- Regions and deployment targets
A written scope lets architects choose the right data flows, infrastructure, and testing needs before writing hours into a budget.
2. Estimate Hours by Development Phase
Each phase of the project consumes a predictable share of the total hours. Splitting estimates across phases avoids the common mistake of grouping all work into a single bulk figure. Here are typical percentage ranges used by software teams:
| Phase | Typical % of Total Hours |
| Discovery & planning | 10% |
| UI/UX design | 15% |
| Development (frontend + backend) | 50% |
| Quality assurance | 15% |
| Project management | 7% |
| Deployment | 3% |
Note: Regulated apps (Healthcare, Finance, Defense) typically shift more weight away from core development and into QA, security auditing, and compliance documentation.
3. Set Hourly Rates by Resource Type
Once hours are listed, you need accurate rate inputs. Rates vary by skill, region, and compliance domain knowledge. Senior developers and architects cost more but reduce rework and avoid structural mistakes. Here are common ranges used across regions:
| Role | Typical Rate Range (USD/hr) |
| Junior developer | $25–$50 |
| Mid-level developer | $50–$100 |
| Senior developer | $100–$180 |
| Designer | $60–$120 |
| QA engineer | $40–$90 |
| DevOps / Cloud engineer | $80–$150 |
Regulated apps in FinTech or HealthTech often require senior engineers for encryption, data flows, and audit requirements. That shifts the blended hourly rate upward.
4. Apply the Formula to Each Phase
With hours and rates defined, apply the cost formula. This makes assumptions transparent and prevents scope inflation during review. Here is an example breakdown using typical rates:
- Discovery & planning: 120 hrs × $100/hr = $12,000
- UI/UX design: 180 hrs × $90/hr = $16,200
- Dev (frontend/back-end): 800 hrs × $110/hr = $88,000
- QA: 200 hrs × $70/hr = $14,000
- PM: 150 hrs × $100/hr = $15,000
- Deployment & infra setup: 80 hrs × $110/hr = $8,800
A phase-based estimate gives leaders a line-item view of where budget goes and why.
5. Include Fixed Costs and One-Time Setup Fees
Some expenses are not tied to developer hours. These are often missed during early planning and show up late in the cycle. Here are common fixed items to add:
- Wireframes and prototype work
- Cloud setup (accounts, policies, network rules)
- CI/CD setup for mobile builds
- Monitoring and alerting setup
- App Store accounts and review fees
- Initial security checks
Depending on scope, these can add $5,000 to $25,000.
6. Add Maintenance and Support Budget
Apps need continuous updates. OS changes, SDK updates, security patches, and infra shifts create ongoing work that must be funded. Here are the main categories to include:
- Bug fixes and patch releases
- Server updates and refactoring
- Performance tuning
- Crash rate monitoring
- Security updates
- Device and OS compatibility checks
Most teams allocate 15–20 percent of the initial build cost per year for maintenance.
7. Apply Risk and Scope Buffers
Risk buffers protect against unknowns. These usually relate to integrations, compliance, or unclear feature flows. Here are the typical triggers for cost variance:
- Third-party API gaps
- New compliance findings
- Scope drift from feature owners
- Additional device testing
- Late design changes
A 10–20 percent buffer covers these without forcing mid-cycle budget expansions.
8. Review Architecture Impact on Cost
Architecture decisions directly influence estimates. Some features require queue workers, microservices, load balancers, or multi-tenant data isolation. Here are the common paths and their cost impact:
- Monolithic backend
- Lower initial setup
- Straightforward testing
- Limited long-term flexibility
- Modular or service-based backend
- Higher initial setup
- Clear boundaries for scaling
- Better for regulated or high-traffic apps
Apps with real-time messaging, geolocation tracking, or heavy media flows often need worker queues and caching layers. This increases hours across backend, DevOps, and QA.
9. Account for Compliance and Security Overheads
Apps in regulated spaces need more work around data, logging, and isolation. Estimates must reflect this, so teams are not surprised during audits. Here are common overhead items:
- Encryption setup
- Audit logs and retention rules
- Access control layers
- Testing against compliance checklists
- Documentation for auditors
FinTech teams face PCI-DSS scope decisions and tokenization needs. HealthTech teams face HIPAA rules and PHI access logs. Logistics teams face multi-tenant isolation and tracking accuracy requirements.
10. Validate Estimates with Models and Benchmarks
Once you build an estimate, validate it against industry ranges and past projects. This stops under-scoping early. Here are the sources teams use to validate numbers:
- Internal project history
- COCOMO or size-based estimation models
- Industry ranges (e.g., $40,000 to $400,000+ for full builds)
- Vendor benchmarks
- Regional rate averages
A validation pass catches unrealistic assumptions and helps leadership trust the numbers.

To refine your budget further, let’s examine the key elements that can influence the final cost of your mobile app.
Also Read: Hybrid Mobile App Development: A Beginner’s Guide
Key Factors That Affect Mobile App Development Costs
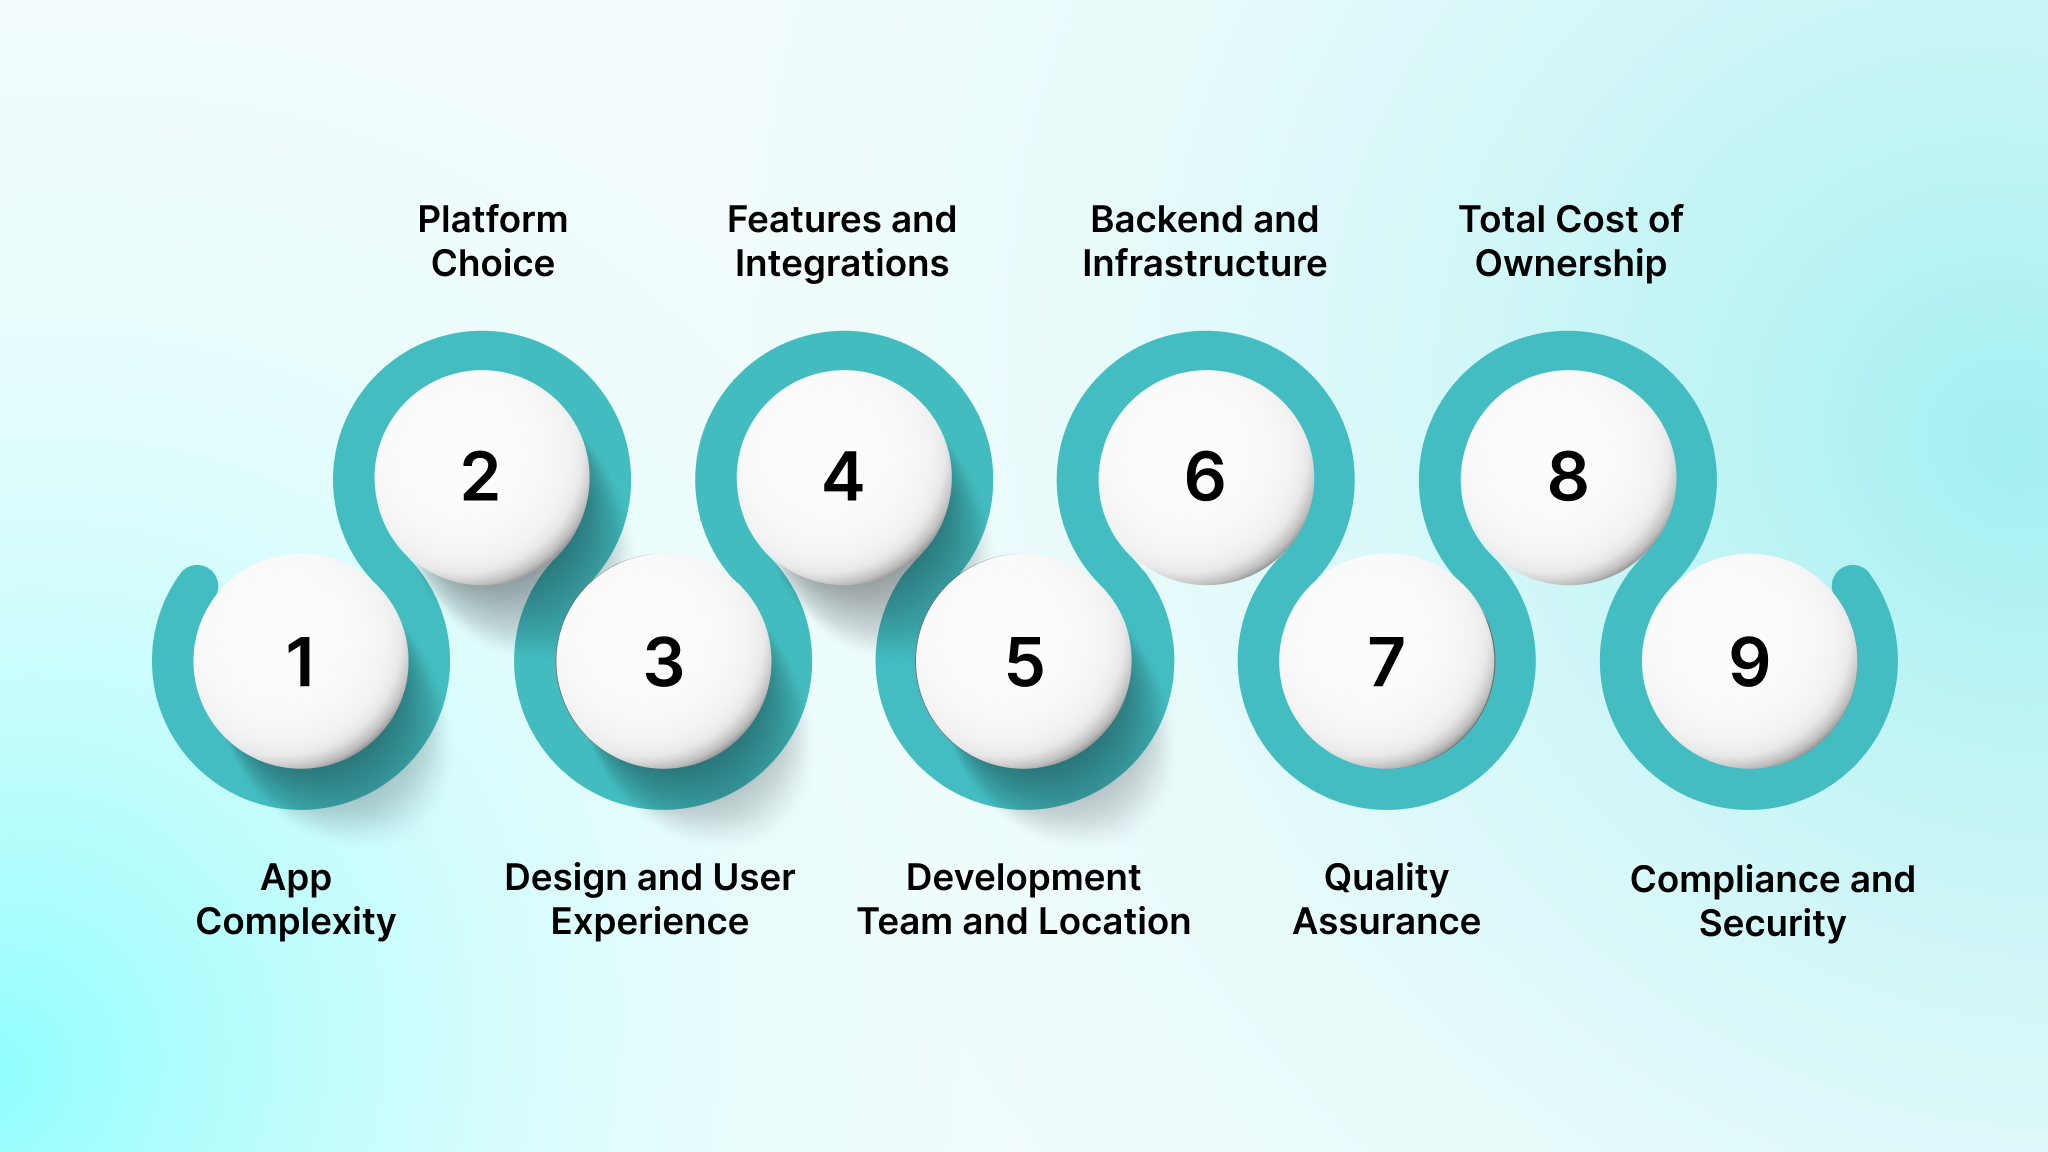
Cost varies based on the depth of features, backend demands, compliance scope, and the level of scale a product must support. These factors shape both engineering hours and infrastructure needs. To make scoping clearer for technical leaders, here are the core areas that influence budgets in 2026.
App Complexity
App complexity defines the architecture, team structure, and depth of QA required. As complexity rises, engineering work expands across backend services, client logic, data flows, caching, and infrastructure. This is the strongest driver of cost because it influences every layer of the system.
Here are the factors tied to complexity:
- Feature depth: Basic login and static data are low cost, while flows such as multi-step onboarding, cart logic, background sync, or role-specific dashboards raise development hours.
- Data handling: Apps that cache data, sync in background jobs, or operate offline require queue workers, retry logic, and conflict resolution rules. These add backend and QA time.
- Event-driven behavior: Apps with notifications, live tracking, or activity feeds often need WebSockets or pub/sub channels. This expands infra setup and test coverage.
- AI or ML features: Prediction models, personalized recommendations, or image analysis add work in data pipelines, model hosting, and monitoring. Industry references show that AI-enabled apps cost 20–40 percent more due to these steps.
- Compliance factors: Apps in FinTech, HealthTech, and logistics require strict data controls, which increases backend and QA scope.
Platform Choice
Your choice of platform affects release cadence, QA scope, and long-term maintenance. Native iOS and Android offer strong device-level features, while cross-platform frameworks reduce initial build time. The right path depends on device needs, performance targets, and internal capabilities.
Here are the key considerations:
- iOS: Fewer device variations mean cleaner QA cycles. Apple enforces stricter UI and permission patterns, so design iteration may increase.
- Android: Fragmentation raises QA hours. Device-level behavior differs across Samsung, Xiaomi, Oppo, Pixel, and budget ranges. Teams often test across 10–20 devices to ensure reliability.
- Cross-platform frameworks (Flutter, React Native): Industry reports show Flutter reduces development time by 30–40 percent for typical feature sets, since native modules only cover device-specific components.
- Native builds (Swift, Kotlin): Best when performance, hardware access, or OS-level capabilities are priorities, such as AR-heavy apps, advanced media editing, or Bluetooth flows.
- Long-term release impact: Dual native teams double release coordination and testing. Cross-platform takes less time per release but may require custom native patches for high-performance modules.
Design and User Experience
Design cost grows as UI complexity increases across states, transitions, and gestures. Each interaction requires engineering time, and every new state adds QA permutations. For some sectors, precise UI behavior is critical due to compliance rules or operational risk.
Here are the factors that influence design cost:
- Template UI: Lower design cost and quicker implementation. Good for internal tools or basic MVPs.
- Custom UI/UX: Unique layouts, micro-interactions, animations, and gesture-heavy flows increase both design hours and frontend implementation time.
- Accessibility and localisation: WCAG compliance, RTL layouts, and language expansion add extra design and QA cycles.
- User testing: Iterative testing extends design timelines, especially for regulated flows.
Features and Integrations
Each feature introduces its own engineering paths, backend logic, API contracts, and test suites. Some features, like payments or messaging, require full subsystems rather than simple components. This is where estimates often expand fastest.
Here are the areas that influence cost most:
- Authentication: Email login is low cost. OAuth (Google, Apple), SSO (Okta), or MFA require extra backend and state management.
- Notifications: Push requires device token handling, notification templates, retry queues, and analytics. Complex notification rules add backend workers.
- Payments: Stripe, Braintree, or Apple Pay integrations need secure storage rules, PCI-DSS awareness, error states, and transaction reconciliation.
- Geolocation: GPS tracking, route drawing, ETA calculations, and geofencing require mapping SDKs and high QA coverage.
- Messaging or chat: Chat systems need WebSockets, message persistence, read receipts, typing indicators, and offline queues.
- Advanced capabilities: AI summaries, AR kits, IoT device links, or blockchain data validation all add hours across backend, mobile, and QA.
Development Team and Location
Team structure affects velocity, code quality, and overall cost. Rates differ by region, but structure also matters: specialists reduce rework, while mixed teams allow more predictable delivery. Compliance-heavy industries require experienced engineers, not entry-level talent.
Here are the factors that shift cost:
- Role composition: Senior architects and DevOps have higher rates but reduce downstream corrections.
- Engagement model: Freelancers reduce direct cost but increase coordination. Structured teams offer project management and QA.
- Regional rates: North America and Western Europe sit at the higher end. Eastern Europe and South Asia offer lower hourly bands.
- Compliance experience: Apps touching payments or PHI require architects experienced with PCI-DSS, SOC 2, or HIPAA, which increases hourly rates.
Backend and Infrastructure
Backend and infra decisions define the product’s stability and scalability. Many apps depend heavily on backend operations, which often consume more engineering time than the mobile UI. The selection of cloud tools, architecture patterns, and deployment strategies impacts both initial and ongoing cost.
Here are the primary cost drivers:
- Architecture choice: Monolithic backends reduce early complexity, while modular or microservice designs offer scale but require more setup.
- Data stores: SQL for transactional accuracy, NoSQL for flexible schemas, and hybrid storage for mixed workloads.
- Workers and queues: Background jobs for billing, exports, notifications, or ML processing require orchestration and monitoring.
- CI/CD and environments: Managing pipelines, staging environments, rollback workflows, and automated deployments increases setup time.
- Observability: Metrics, logs, and tracing via OTel or similar stacks add upfront work but reduce on-call time.
Testing and Quality Assurance
QA ensures releases meet stability expectations and compliance requirements. Testing time expands when device coverage grows, API integrations increase, or regulatory flows demand precise behavior. High-traffic or regulated apps need deeper QA practices.
Here are the QA cost factors:
- Device matrix: Android fragmentation widens test cycles. Device farms or real devices increase test coverage cost.
- Automation: Initial scripting hours are higher, but regression cycles shrink when automated.
- Security testing: Static scans, dependency checks, and penetration tests required for FinTech or HealthTech.
- Performance testing: Logistics, marketplace, or live-stream apps require p95/p99 latency testing and load validation.
Maintenance, Support, and Total Cost of Ownership
Post-launch work is continuous. OS updates, dependency upgrades, and server costs change over time. Planning maintenance prevents surprise expenses and keeps the product stable. Here are the areas that reflect long-term cost:
- Annual maintenance: Plan 15–20% of initial build for updates, patches, and small improvements.
- Cloud expenditure: Traffic growth, storage, API usage, and CDN egress influence monthly bills.
- SLAs and monitoring: Higher uptime commitments require additional tooling, alerting, and on-call processes.
- Technical debt control: Set aside time for cleanup sprints to avoid compounding maintenance work.
Compliance and Security
Regulated industries introduce heavy requirements for data control, traceability, and documented evidence. This impacts design, backend logging, encryption, access rules, and QA processes. Teams often underestimate how much compliance work expands scope. Here are the compliance-driven cost factors:
- FinTech: PCI-DSS scoping, KYC/AML flows, encrypted transaction paths, and audit log retention.
- HealthTech: HIPAA controls, PHI storage rules, access event logging, and secure environment setups.
- Data protection: GDPR consent mechanisms, user data export/delete workflows, and DPIA documentation.
- Security audits: Pen tests, cloud configuration reviews, and audit prep for regulated verticals.
Now that you’ve identified the key cost drivers, let’s look at specific app categories and their typical cost ranges.
Also Read: Best Cross Platform Mobile App Development Frameworks for 2025
Cost Benchmarks for Common App Types
Cost varies widely by category because each type comes with its own backend patterns, data flows, compliance scope, and infrastructure expectations. These examples help anchor your estimates in concrete patterns that engineering teams see across the market. They are reference points, not templates, but they give a grounded sense of scale.
Here are the benchmarks most teams use when evaluating app categories:
Messaging Apps (WhatsApp-style)
Messaging apps require real-time throughput, message delivery guarantees, and backend structures capable of handling spikes in traffic. The main cost driver is not UI, but the messaging engine, queues, and storage patterns. Expect significant QA and load testing for p95/p99 latency.
Here are the factors behind the cost:
Cost range: $150,000–$350,000+
Key components:
- Real-time transport: WebSockets or pub/sub with message queues
- Storage model: Indexed message stores with retention rules
- Read states: Read receipts, typing indicators, delivery statuses
- Security: End-to-end encryption workflows for sensitive conversations
- Moderation: Tools or pipelines for message flagging and abuse detection
Music or Audio Streaming Apps (Spotify-style)
Audio streaming requires stable content delivery, licensing compliance, and robust analytics on user listening behavior. The cost increases when you add offline playback, user-generated playlists, and dynamic recommendation engines.
Here are the factors behind the cost:
Cost range: $250,000–$500,000+
Key components:
- Media delivery: CDN-backed streaming endpoints
- Offline mode: Local encryption and sync logic
- Licensing: Compliance workflows and catalog rules
- Analytics: Track listens, skips, and retention metrics
- Search: Fast catalog search with indexing
Video Streaming Apps (Netflix-style)
Video apps require heavy backend workloads, high-resolution streaming, and device-specific performance tuning. The infrastructure demands grow quickly with user volume.
Here are the factors behind the cost:
Cost range: $300,000–$600,000+
Key components:
- DRM: Encrypted streams and device-level validation
- Adaptive streaming: Quality adjustments based on connection
- CDN costs: High global traffic and caching strategies
- User profiles: Watch history, watchlists, multi-profile support
- Moderation: Age ratings and content filters
Food Ordering Apps (KFC or similar)
Food delivery systems require precise order routing, menu syncing, promotions, and store-level variations. The backend handles time-based menus, surge periods, and third-party logistics integrations.
Here are the factors behind the cost:
Cost range: $120,000–$250,000+
Key components:
- Menu management: Region-specific variations
- Orders and payments: Secure flows with tip logic and refunds
- Tracking: Pickup, preparation, and delivery event states
- CRM: Offers, coupons, loyalty points
- Kitchen dashboards: For order preparation workflows
Dating Apps (Tinder-style)
Dating apps are driven by recommendation engines, swipe logic, match scoring, and safety controls. The complexity lies in backend data models and real-time matching.
Here are the factors behind the cost:
Cost range: $150,000–$300,000+
Key components:
- Recommendation logic: Match scoring and distance filters
- Swipe engine: Interaction tracking and throttling
- Chat: Real-time chat layer with reporting features
- Safety tools: Blocking, reporting, and review queues
- Identity checks: Optional verification methods
Social Apps (Snapchat-style)
Social products blend camera, filters, messaging, ephemeral content, and moderation systems. Complexity spikes with media processing, storage retention logic, and user safety workflows.
Here are the factors behind the cost:
Cost range: $250,000–$600,000+
Key components:
- Camera features: Filters, overlays, AR elements
- Content feed: Ranking algorithms and scroll performance tuning
- Ephemeral content: Time-based retention and deletion
- Notifications: Multi-condition triggers for engagement
- Moderation: Automated and manual review pipelines
E-commerce Apps (Adidas-style)
E-commerce requires catalog logic, inventory state, promotions, secure payments, and returns handling. Backend systems become the primary cost drivers once product variation and warehouse rules expand.
Here are the factors behind the cost:
Cost range: $100,000–$250,000+
Key components:
- Catalog: Variants, sizes, stock status, categories
- Payments: Apple Pay, Google Pay, cards, wallets
- Cart logic: Discounts, vouchers, combo rules
- Returns: RMA flows, pickup scheduling, refund tracking
- Analytics: Purchase funnels and cohort retention
Ride-Hailing Apps (Uber-style)
Ride-hailing systems require complex mapping, dispatch algorithms, surge logic, and multi-party tracking loops. Both driver and rider apps must update frequently with low latency.
Here are the factors behind the cost:
Cost range: $250,000–$600,000+
Key components:
- Location tracking: Continuous updates with p95 accuracy targets
- Matching engine: Supply-demand matching with wait-time prediction
- Pricing: Surge logic and fare calculation rules
- Payments: Driver payouts and rider billing
- Safety: Trip sharing, SOS flows, and driver verification
Short-Form Video Apps (TikTok-style)
Short-form video is one of the most expensive categories due to encoding, moderation, and personalized feeds. Scaling costs grow fast with user uploads.
Here are the factors behind the cost:
Cost range: $400,000–$1M+
Key components:
- Video ingestion: Compression, transcoding, and queue workers
- Feed ranking: Behavior scoring and video recommendations
- Moderation: AI detection + human review processes
- Creator tools: Filters, editing, sounds, captions
- CDN usage: High-bandwidth global distribution
While knowing benchmarks is helpful, it’s just as important to consider how team models and regional factors can impact the budget.
Also Read: Ecommerce Mobile App Development Guide and Steps
How Team Models and Regions Impact App Cost
The structure of your engineering team shapes delivery speed, clarity of ownership, and the long-term cost profile of your product. Rates vary across regions, but the bigger influence is how the team is organized and who controls infra, releases, and IP.
Each model comes with its own strengths, coordination needs, and risk surface. Pick based on release goals, compliance requirements, and internal bandwidth.
1) Dedicated Product Pod
A pod combines backend, mobile, QA, and DevOps into one delivery unit. This model produces consistent velocity because the same engineers stay on the codebase without rotation or handoffs.
Here are the factors to consider:
- Predictable burn: Consistent sprint cadence and measurable output
- Clear ownership: One group handles feature build, testing, and release
- Fast onboarding: Stable team structure reduces context switching
- Controlled releases: Fewer coordination gaps during handoffs
2) Split Vendor + Internal Team Model
Your internal team leads roadmap decisions while the external group handles execution. This is common when an organization wants full product control but lacks delivery capacity.
Here are the factors to consider:
- Shared responsibility: Internal product direction paired with external delivery
- Infra access clarity: Define roles for cloud accounts and CI pipelines
- IP structure: All artifacts, repos, and configs must remain with your company
- Handover cycles: Plan structured knowledge transfer as teams scale or change
3) Outsourcing Model (Full External Delivery)
This model places all engineering work with an external partner. It suits teams that need predictable delivery without expanding internal headcount, but it requires clear terms for ownership and release processes.
Here are the factors to consider:
- Ownership rules: Repos, branches, cloud accounts, and credentials must belong to your organization, not the vendor
- SLA definition: Release frequency, defect turnaround time, and uptime targets must be written into the agreement
- Access control: Enforce least-privilege access, key rotation, and audit logs
- Communication loops: Weekly sprint reviews and demos reduce misalignment
- Cost structure: Usually lower than in-house teams, more stable than contractor-only models
4) Staff Augmentation (Individual Contractors)
This approach fills specific skill gaps with temporary contributors. It is helpful for targeted work but requires strong internal oversight.
Here are the factors to consider:
- Internal coordination: Your team owns planning and code reviews
- Ramp-up time: Contractors need orientation on architecture and coding standards
- QA load: Higher requirement for internal testing and validation
- Turnover risk: Individuals may exit without long-term commitment
Regional Cost Differences
Hourly rates vary by region due to differences in supply, demand, and expertise. Rates also depend on factors like the scope of the project, compliance needs, and the level of architectural complexity required. The rates listed below represent blended figures, accounting for a mix of senior, mid-level, and junior developers:
| Region | Hourly Range | Notes |
| US / Canada | $100–$180/hr | Strong senior talent pool for FinTech and HealthTech |
| Western Europe | $80–$150/hr | Deep experience in large-scale backend systems |
| Eastern Europe | $40–$70/hr | Often selected for mobile pods with a strong engineering culture |
| South Asia (India/Vietnam) | $25–$60/hr | Large delivery teams with flexible staffing across roles |
Note: Compliance-heavy builds necessitate senior-heavy staffing across regions due to specialized expertise, pushing senior engineer rates to the upper range.
Once you grasp the influence of team models and regions on costs, you’ll want to know how to manage budgets effectively without sacrificing quality.
Also Read: How to Outsource App Development Without Risk
Proven Ways to Control Mobile App Development Costs Without Sacrificing Quality
Mobile budgets grow quickly when the scope expands without structure or when technical debt forms early. Cost control is not about cutting corners but about making deliberate choices that prevent rework, reduce risk, and keep delivery steady. The goal is to spend where it matters and avoid spending where it doesn’t.
Here are the practical steps that help teams reduce cost without lowering product standards:
- Define scope with clear priorities: List features by value, not by preference. Split them into launch-critical, phase-two, and optional items. This refines both timeline and architecture choices.
- Run a dedicated discovery and architecture phase: A focused 2–4 week phase helps clarify user flows, backend requirements, data models, and cloud setup. This reduces changes during development and prevents duplication of work.
- Use cross-platform frameworks for standard flows: Flutter or React Native shorten build time for products where UI parity matters more than deep hardware interaction. Treat modules like camera-heavy or AR features as native add-ons.
- Automate regression testing: Automated tests reduce manual QA cycles for every release and help prevent costly bugs from reaching production. In multi-platform apps, automation stabilizes release cadence.
- Invest early in CI/CD pipelines: A proper pipeline catches errors before they reach QA and cuts down time spent on manual builds. Include automated linting, unit tests, environment checks, and automated deploys.
- Limit custom animations unless they drive core value: Custom motion and transitions raise both design and engineering hours. Use them only when they support user flows or brand identity.
- Choose backend architecture that fits your scale: Early microservices introduce extra overhead if you don’t need them. A well-structured modular backend or monolith is often more cost-effective for the first 12–24 months.
- Use proven third-party APIs when they cover non-core features: Payments, messaging, analytics, identity, and push notifications are mature services. Buying instead of building avoids weeks of engineering effort.
- Control compliance scope early: Apps in FinTech, HealthTech, or logistics need explicit security and audit rules. Document these before development to prevent later rework across backend, UI, and QA.
- Set release cadence expectations at project start: Weekly or biweekly sprint releases help avoid large merges and reduce integration bugs. A predictable rhythm also tightens feedback loops.
- Review infra costs during development, not after launch Track cloud spend as features ship. Evaluate where caching, CDNs, or instance right-sizing can reduce monthly bills without risking performance.
Now that you have strategies for cost management, let’s explore how a partner like DEVtrust can help with the development process.
How DEVtrust Helps You Implement Mobile Apps
Mobile delivery works best when backend decisions, mobile builds, QA depth, and compliance reviews move together. DEVtrust structures projects around clear architecture choices, controlled sprints, and predictable release cycles. This reduces rework and gives engineering leaders visibility into cost, risk, and ownership from day one.
Here are the areas where DEVtrust brings structured capability:
- Full-cycle mobile engineering
Native iOS (Swift) and Android (Kotlin) for hardware-driven features, plus React Native, Flutter, and Ionic for cross-platform delivery. Each track includes structured state management, data-binding patterns, and device-level permission handling, ensuring consistency across multi-platform releases.
- Architecture and scalability planning
Early decisions on monolithic, modular, or microservice architectures based on user load, compliance, and release cadence. DEVtrust defines caching strategies, worker jobs, and data retention rules upfront to reduce refactor costs.
- Compliance-focused delivery for U.S. sectors
PCI-DSS for payment flows, SOC 2 audit trails for access events, and HIPAA safeguards for PHI. DEVtrust designs encryption schemes, token handling, and secure secret storage for mobile and backend systems, with documented flows for audits.
- U.S.–offshore hybrid model with overlapping hours
U.S.-based leadership works directly with offshore pods operating with 3–5 hours of daily overlap. This reduces review wait times, accelerates ticket turnover, and keeps decision-making tight during design and engineering cycles.
- Clear cloud ownership and infra access
Projects run in the client’s AWS or Azure accounts. DEVtrust sets up environments, pipelines, and observability stacks, ensuring the client has admin-level access to infra, logs, and deployments.
- Delivery with defined SLAs
Two-week sprints with acceptance criteria and stability targets for mobile and backend. Mobile releases follow crash-rate budgets, and backend endpoints meet p95 latency expectations tied to scale assumptions.
- QA with deep device coverage
Manual and automated regression suites, device-farm testing, and performance checks for p95/p99 latency. This includes security scanning, dependency checks, and validation of rate limits for integrated APIs.
- Specialized integration experience
Integration with payments (Stripe, Braintree, Apple/Google Pay), identity services, analytics platforms, and logistics APIs. DEVtrust handles contract validation, error mapping, sandbox stress testing, and fallback states for third-party outages.
- Flexible engagement models
Fixed price for well-defined scopes, time-and-materials for evolving roadmaps, or a dedicated pod for long-term product growth. Each model includes sprint tracking, burn reporting, and shared dashboards.
To illustrate how DEVtrust supports mobile app development, let’s look at a successful case study from the health and wellness sector.
A HealthTech client (Must Motivate) required stable device sync and higher engagement. DEVtrust integrated device SDKs, built a unified data interface, added CBT assessments, and created a gamified challenge system. Health-data sync reached 98% accuracy, and user trust scores increased by 95% after launch.
Conclusion
Mobile app budgets only stay predictable when scope, architecture, and compliance needs are defined early. The most successful projects follow a clear plan: phased delivery, structured QA, transparent ownership of code and infra, and regular checkpoints to keep risk under control.
If your goal is to build a stable mobile app with clear cost expectations, start with accurate scoping and a delivery model that supports rapid feedback, consistent QA, and long-term maintainability.
Ready to start your mobile app journey? Connect with us today for a tailored strategy and expert guidance to bring your vision to life.